Skip to main content
Toggle navigation
Search
Search
Main navigation
BNDU
Data Sharing Platform
Data Sets
CHAMBER
Repositories
User account menu
Log in
2024
He S
,
Brown P
,
Tan H
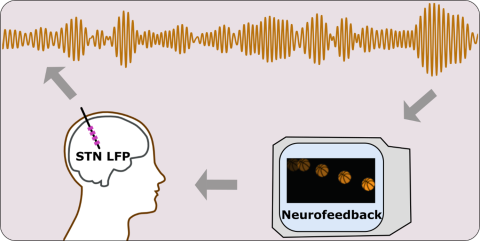
LFPs and EEGs from patients with Parkinson’s disease during neurofeedback training
10.60964/bndu-4jde-7j28
Download
You can download or request access to this data set when you are
registered
and
logged in
.
He S
,
Tan H
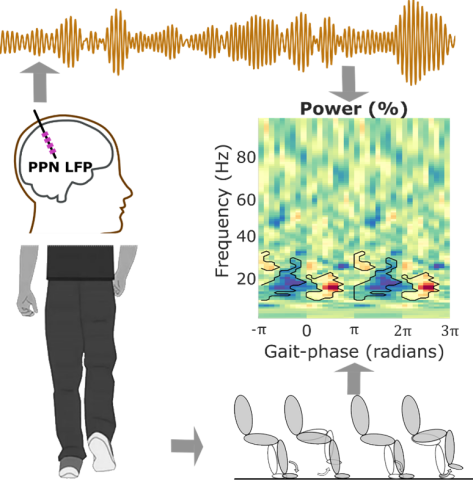
LFPs and EEGs from patients with Parkinson’s disease or multiple system atrophy during gait
10.60964/bndu-w6mx-gv64
Download
You can download or request access to this data set when you are
registered
and
logged in
.
Perestenko PV
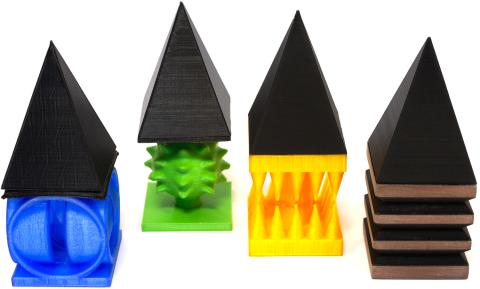
3D printable files for objects to use in mouse object recognition tasks
10.60964/bndu-gq68-jz91
Download
You can download or request access to this data set when you are
registered
and
logged in
.
Gava GP
, Lefèvre L
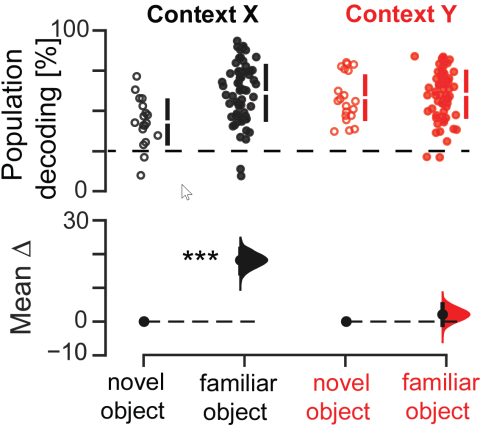
Analysis of hippocampal ensembles during Contextual Feeding and cNOR tasks
10.60964/bndu-r97n-bg26
Download
You can download or request access to this data set when you are
registered
and
logged in
.
Lefèvre L,
Gava GP
Hippocampal ensemble recordings in Contextual Feeding and cNOR tasks from mice
10.60964/bndu-mzg5-v129
Download
You can download or request access to this data set when you are
registered
and
logged in
.
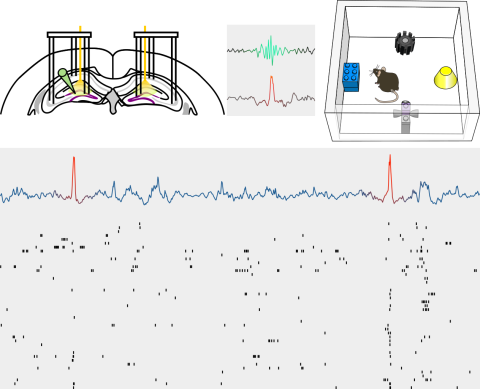
McHugh SB
Triple hippocampal (DG-CA3-CA1) multichannel tetrode recordings from mice exploring spatial arenas and during sleep/rest epochs
10.60964/bndu-fkaq-ma45
Download
You can download or request access to this data set when you are
registered
and
logged in
.
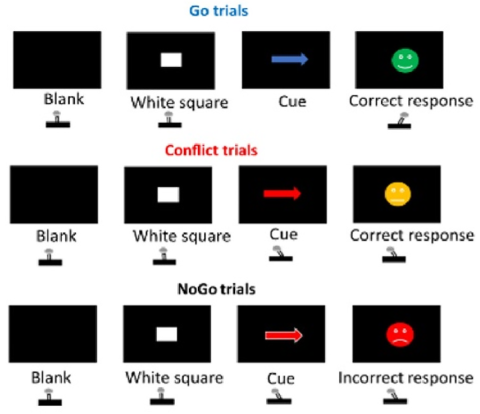
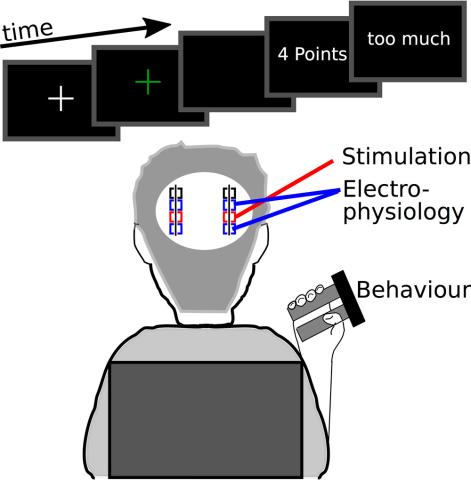
Mandali A, Torrecillos F, Wiest C,
Pogosyan A
,
He S
,
Tan H
,
Stagg CJ
,
Cagnan H
Electroencephalogram (EEG) and behavioural data concerning the Go/NoGo/Conflict task
10.5287/ora-qqd05nv46
Download
You can download or request access to this data set when you are
registered
and
logged in
.
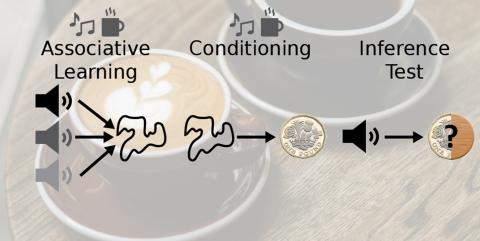
Shearer C,
Rawson AB
, O'Reilly JX,
Barron HC
Human behavioural and eye-tracking data from inference task with targeted memory reactivation
10.60964/bndu-zy02-1973
Download
You can download or request access to this data set when you are
registered
and
logged in
.
2023
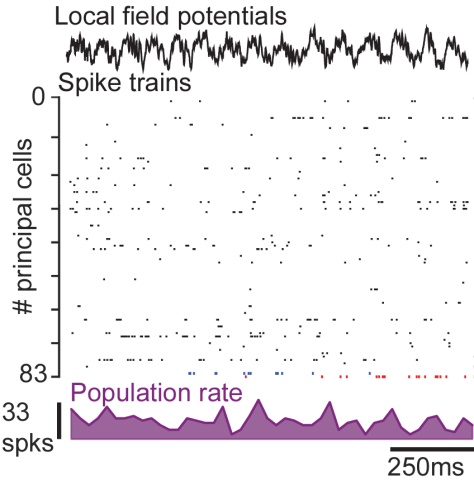
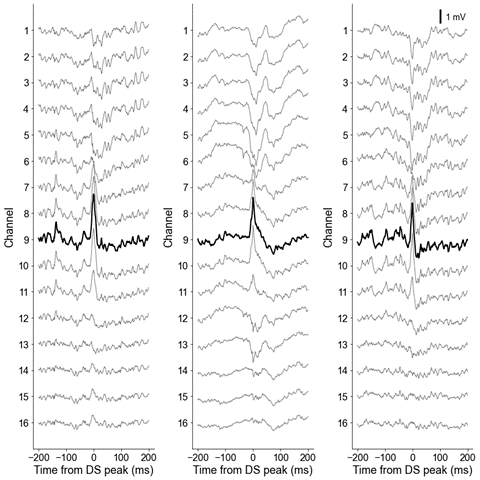
Lopes-Dos-Santos V
,
Dupret D
Dentate Spike Waveforms
10.5287/ora-wrbzrbwpk
Download
You can download or request access to this data set when you are
registered
and
logged in
.
Herz DM
, Groppa S,
Brown P
Subthalamic nucleus correlates of force adaptation
10.5287/ora-9ovjdypbb
Download
You can download or request access to this data set when you are
registered
and
logged in
.
Pagination
First page
« First
Previous page
‹‹
Page
1
Current page
2
Page
3
Page
4
Page
5
Page
6
Next page
››
Last page
Last »
Search
Search
Filter by type
recorded data
(37)
neuroimaging
(4)
behavioural
(15)
electrophysiology
(22)
voltammetry
(1)
human
(28)
rodent
(9)
code
(25)
modelling
(7)
analysis
(18)
methodological
(20)
analysis
(18)
equipment
(2)
Filter by group
Tan Group
(15)
Bogacz Group
(13)
Dupret Group
(10)
He Group
(7)
Barron Group
(5)
Magill Group
(4)
Stagg Group
(4)
Cagnan Group
(2)
Sharott Group
(2)