2025
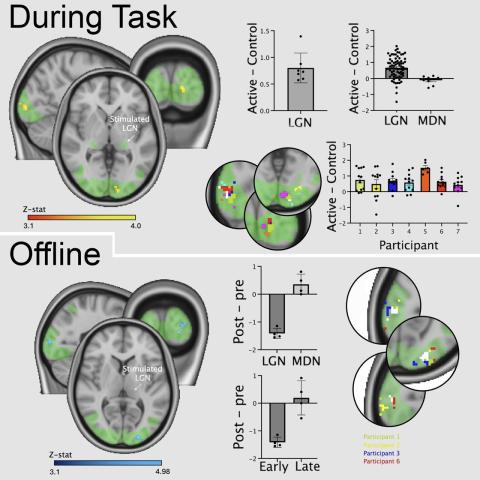
Koolschijn RS, Browning M, Przygodda X, Capitão L, Clarke WT, O'Reilly JX, Barron HC
BNDU-Z7QY-JP81
Martin E, Roberts M, Grigoras IF, den Boer T, Stagg CJ, Treeby BE
Group analysis results showing the effects of transcranial ultrasound stimulation on thalamic nuclei
10.60964/bndu-zgk7-jg52
Gann M, Schwab B, Stagg CJ
10.60964/bndu-mw4b-t114
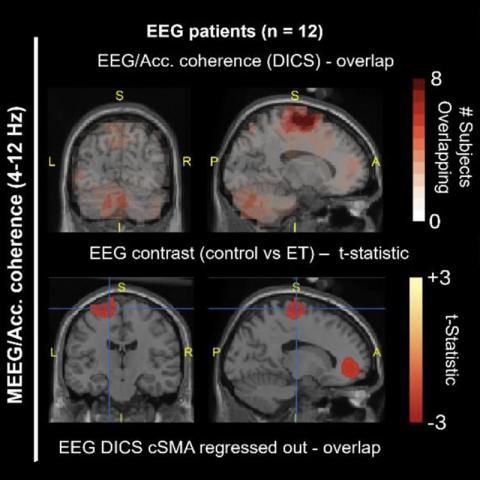
West TO, Steidel K, Flessner T, Calvano A, Spedden ME, Pedrosa D, Barnes G, Cagnan H
10.60964/bndu-k5gj-9892