2023

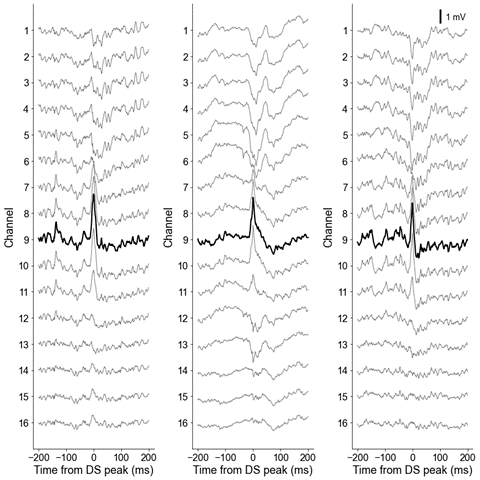
Dentate spike waveforms: Each panel shows the local field potential of each linear probe channel across the dentate gyrus of mouse A during the occurrence of a dentate spike within a 400-ms window around the peak. Dentate spikes are detected from the channel located at the hilus highlighted in black.
Santiago RMM
Lopes-dos-Santos V
Aery Jones EA
Senzai Y
Dupret D
Tort ABL

2021

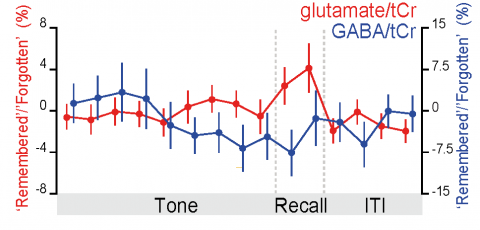
plot of glutate and GABA tCr during trials
Koolschijn R
Shpektor A
Emir UE
Barron H
10.5287/bodleian:8JwYayQmD
image of virtual environment, and images of fMRI and fMRI ouputs being read from brain imaging
Koolschijn R
Shpektor A
Emir UE
Barron H
10.5287/bodleian:vmJOOm7KD
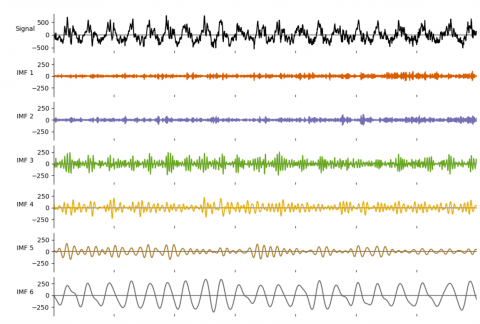
A local field potential plotted and the top in black, and plots of six extracted 'intrinctic mode functions' (IMFs) which are oscillatory, each at a different frequency, with amplitude for each changing throughout the plotted period. The bottom plot, IMF 6, theta, is a large and fairly constant amplitude.
Quinn AJ
Lopes-dos-Santos V
Nobre AC
Dupret D
Woolrich MW
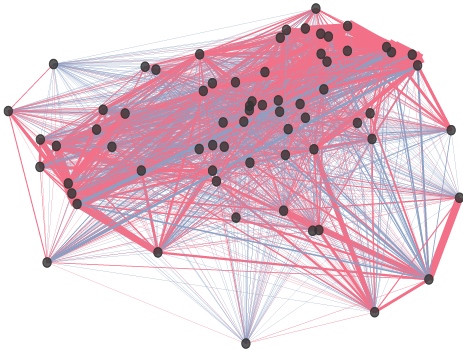
Example co-firing graph. Each node represents one cell. Each edge represents the co-firing association of one cell pair, color-coded according to their correlation’s sign and width proportional to the edge’s absolute value.
Gava GP
McHugh SB
Lefèvre L
Lopes-Dos-Santos V
Trouche S
El-Gaby M
Schultz SR
Dupret D

2018
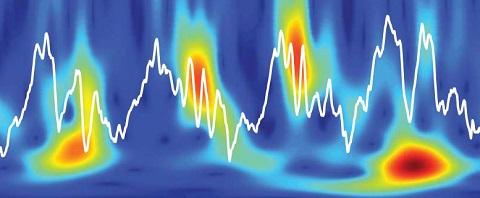
theta-nested spectral power plot
Lopes-dos-Santos V
van de Ven GM
Morley A
Trouche S
Campo-Urriza N
Dupret D