2023
10.5287/ora-jne9aa1z0
Wiest C, Torrecillos F, Morgante F, Pereira EA, Tan H
10.5287/bodleian:QRNQjNpV7
2022
10.5287/bodleian:ZVNyvrw7R
Wiest C, Torrecillos F, Pogosyan A, Baig F, Pereira EA, Morgante F, Ashkan K, Tan H
10.5287/bodleian:mzJ7YwXvo
10.5287/bodleian:wx6D7oenk
10.5287/bodleian:1R9KzGXxM
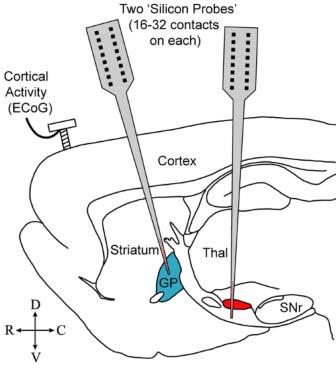
McNamara CG, Rothwell M, Sharott A
10.5287/bodleian:9omadD7Pp
2021
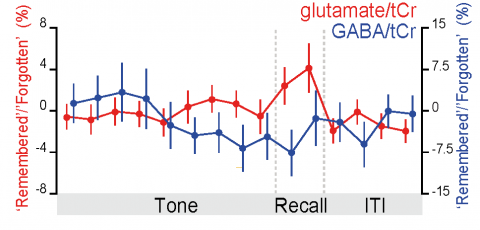
Koolschijn RS, Shpektor A, Emir UE, Barron HC
10.5287/bodleian:8JwYayQmD
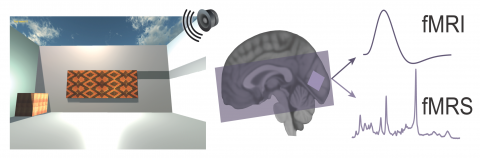
Koolschijn RS, Shpektor A, Emir UE, Barron HC
10.5287/bodleian:vmJOOm7KD
Quinn AJ, Lopes-Dos-Santos V, Nobre AC, Dupret D, Woolrich M