2024

a diagram showing the screens that participants see during the trails- in the go, conflict and no-go situations, including what the joystick positions are.
Mandali A, Torrecillos F, Wiest C, Pogosyan A, He S, Tan H, Stagg CJ, Cagnan H
10.5287/ora-qqd05nv46

2023

diagram of a person facing away from the viewer, with representation of deep brain electrodes in their head, with and illustatraion of the task's screen bing displayed to them, and a grasp-strength measuring device in their hand
Herz DM, Groppa S, Brown P
10.5287/ora-9ovjdypbb

2022

diagram of the back of a participant in the study, showing the stimulus display with moving points, and the electrode arrange ment- an electrode in each side of the brain, and two recording sites per electrode, with a stimulating contact in between the two. The participant holds grasping measuring apparatus in each hand.
Herz DM, Groppa S, Brown P
10.5287/bodleian:1R9KzGXxM
coloured waves of oscillations are layered on top of each other
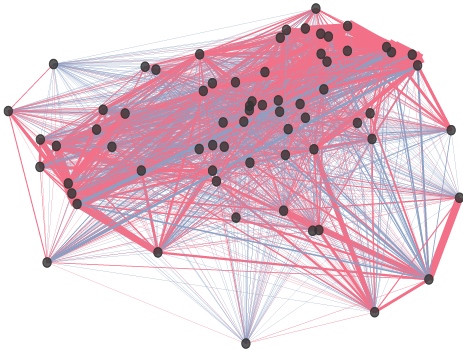
McNamara CG, Rothwell M, Sharott A
10.5287/bodleian:9omadD7Pp

2021

plot of glutate and GABA tCr during trials
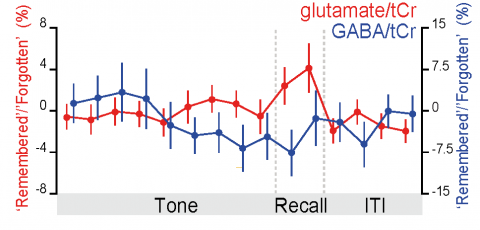
Koolschijn RS, Shpektor A, Emir UE, Barron HC
10.5287/bodleian:8JwYayQmD
Example co-firing graph. Each node represents one cell. Each edge represents the co-firing association of one cell pair, color-coded according to their correlation’s sign and width proportional to the edge’s absolute value.
Gava GP, McHugh SB, Lefèvre L, Lopes-Dos-Santos V, Trouche S, El-Gaby M, Schultz SR, Dupret D

2020

plot showing raw data trace and three processed ones
Yeh CH

2019

three ways of calculating phase-amplitude coupling
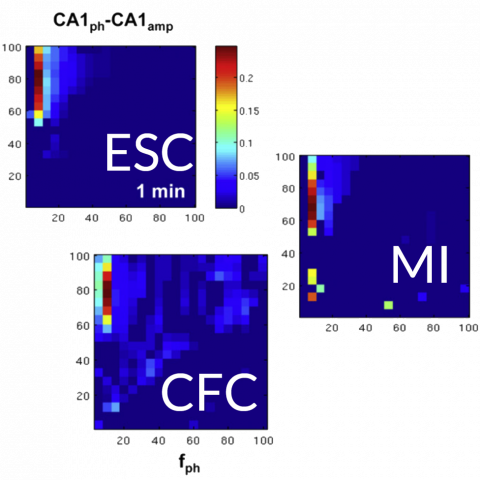
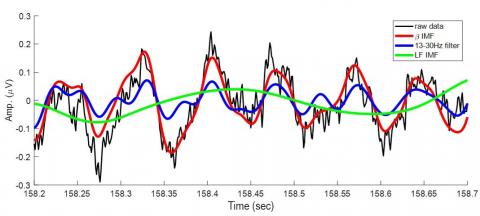
Onslow AC, Bogacz R, Jones MW

2018

firing phase graphic
Weerasinghe G, Bogacz R
10.5287/bodleian:6qJdGNDPj