2023
2022
10.5287/bodleian:1R9KzGXxM
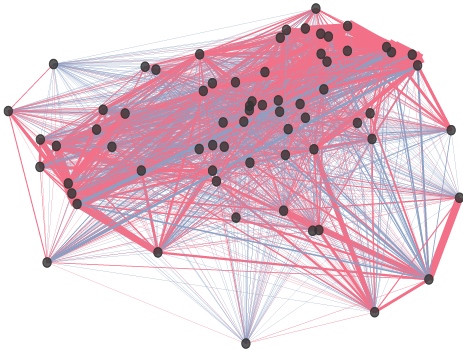
McNamara CG, Rothwell M, Sharott A
10.5287/bodleian:9omadD7Pp
2021
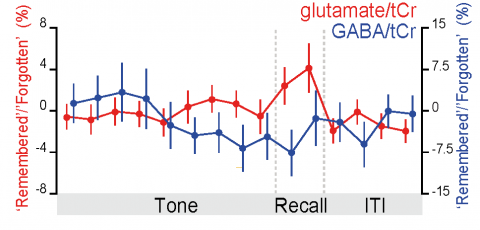
Koolschijn RS, Shpektor A, Emir UE, Barron HC
10.5287/bodleian:8JwYayQmD
2020
2019
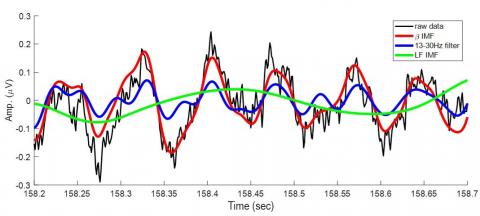
Onslow AC, Bogacz R, Jones MW
2018
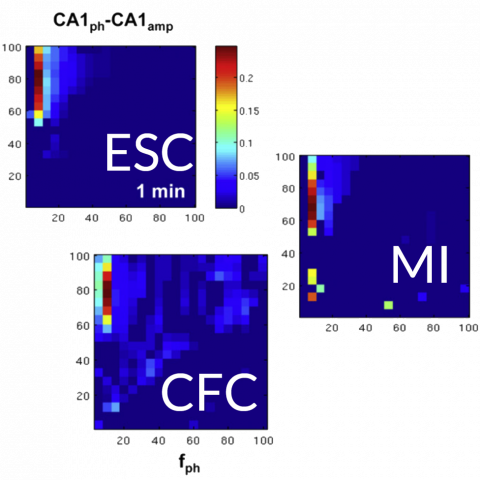
Lopes-Dos-Santos V, van de Ven GM, Morley A, Trouche S, Campo-Urriza N, Dupret D