2025

A figure showing an upper panel with MRI of activitiy during task (top) and after (bottom); also shows graphs showing the results of analysis showing effect of TUS in two areas of the brain.
Martin E, Roberts M, Grigoras IF, den Boer T, Stagg CJ, Treeby BE
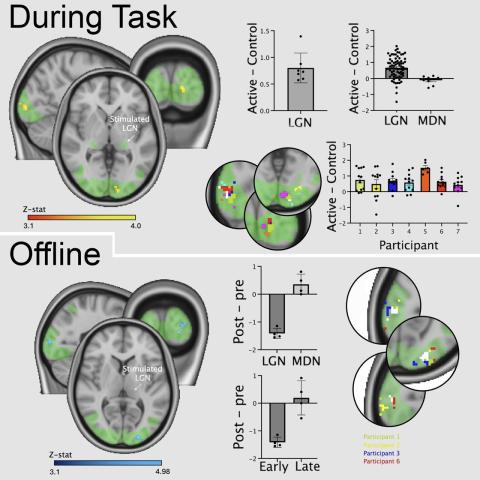
10.60964/bndu-zgk7-jg52
The image is divided into three parts, it depicts hands moving in an alternating manner to sounds on the left, a person receiving transcranial alternating current stimulation in the magnetic resonance imaging scanner in the middle, and an E-field simulation of the stimulation over both primary motor cortices on the right.
Gann M, Schwab B, Stagg CJ
10.60964/bndu-mw4b-t114

2024

a diagram showing the screens that participants see during the trails- in the go, conflict and no-go situations, including what the joystick positions are.
Mandali A, Torrecillos F, Wiest C, Pogosyan A, He S, Tan H, Stagg CJ, Cagnan H
10.5287/ora-qqd05nv46

2023

diagram explaining the abstract of the paper, see link to paper and the abstract on that page.
Schoenfeld MJ, Thom J, Williams J, Stagg CJ, Zich C
10.5287/ora-jne9aa1z0