Skip to main content
Toggle navigation
Search
Search
Main navigation
BNDU
Data Sharing Platform
Data Sets
CHAMBER
Repositories
User account menu
Log in
2024
He S
Brown P
Tan H
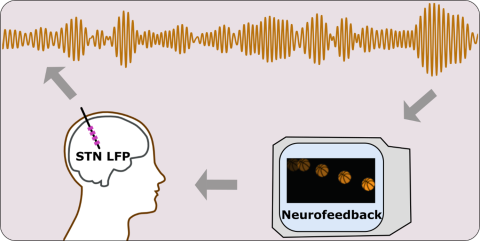
LFPs and EEGs from patients with Parkinson’s disease during neurofeedback training
10.60964/bndu-4jde-7j28
Download
You can download or request access to this data set when you are
registered
and
logged in
.
He S
Tan H
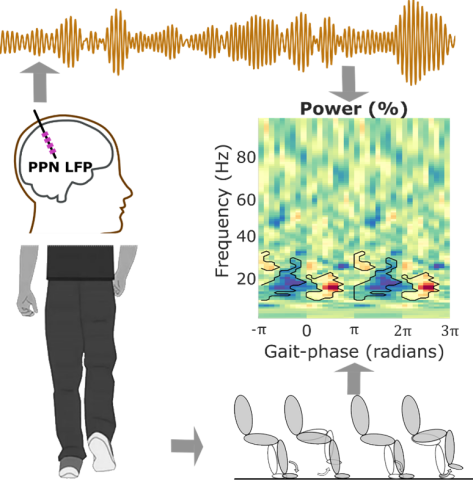
LFPs and EEGs from patients with Parkinson’s disease or multiple system atrophy during gait
10.60964/bndu-w6mx-gv64
Download
You can download or request access to this data set when you are
registered
and
logged in
.
Mandali A
Torrecillos F
Wiest C
Pogosyan A
He S
Coutinho Soriano D
Tan H
Stagg C
Cagnan H
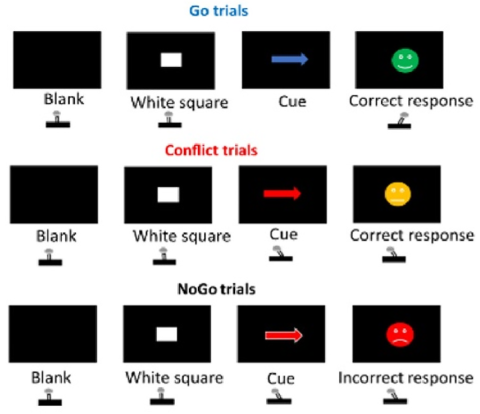
Electroencephalogram (EEG) and behavioural data concerning the Go/NoGo/Conflict task
10.5287/ora-qqd05nv46
Download
You can download or request access to this data set when you are
registered
and
logged in
.
2022
Herz DM
Groppa S
Brown P
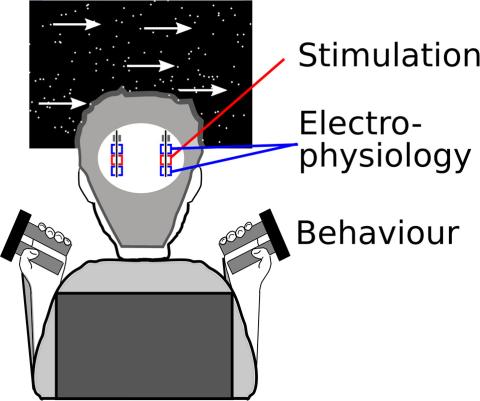
Subthalamic nucleus correlates of decision and movement speed.
10.5287/bodleian:1R9KzGXxM
Download
You can download or request access to this data set when you are
registered
and
logged in
.
Search
Search
Filter by type
recorded data
(4)
(-)
behavioural
(4)
(-)
electrophysiology
(4)
human
(4)
code
(4)
analysis
(4)
(-)
methodological
(4)
analysis
(4)
Filter by group
Stagg Group
(1)
(-)
Tan Group
(4)