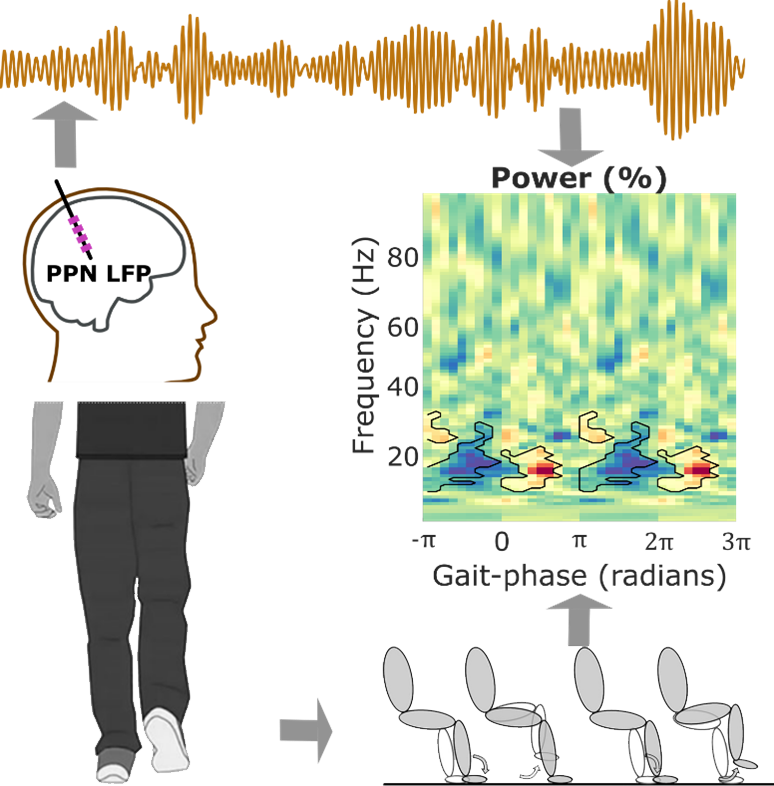
LFPs and EEGs from patients with Parkinson’s disease or multiple system atrophy during gait
Task
The data were recorded from seven patients with Parkinson’s disease (PD01-PD07) and four patients with multiple system atrophy (MSA01-MSA04). All 11 patients are males. The recorded data were bipolar local field potential (LFP) from Pedunculopontine nucleus (PPN), EEGs (at least from Cz, Fz), stepping force (only for MSA patients), accelerometer measurements during free walking (only from some PD patients), pre-operative MRI and post operative CT scans (did not share here due to the embedded identifiable patient information). Please see the publication (He et al., 2021) for more details regarding patients’ clinical details and DBS leads. The data and corresponding experimental protocol are as below:
1. Rest while sitting (PD01-PD07, MSA01-MSA04).
Patients sat comfortably and relaxed with eyes open for 2–3 min.
2. Rest while standing (PD01-PD07).
Patients were standing comfortably with eyes open for 2– 3 min
3. Stepping while sitting (MSA01-MSA04).
Stepped on two pressure sensor plates (Biometrics) guided by a walking cartoon man displayed on a laptop while sitting comfortably in a chair, with a metronome sound provided at the time of each heel strike of the cartoon man, similar to the paradigm used in the previous studies (Fischer et al., 2018; Tan et al., 2018).
4. Stepping while standing (MSA01-MSA02).
Stepped on two pressure sensor plates (Biometrics) guided by a walking cartoon man displayed on a laptop while standing comfortably, with a metronome sound provided at the time of each heel strike of the cartoon man, similar to the paradigm used in the previous studies (Fischer et al., 2018; Tan et al., 2018).
5. Free walking (PD01-PD02).
Walked at their preferred speed along an unobstructed path (~10 m) for 10–30 times.
Data
File name: The data was organized in different folders named by patient ID (e.g., “PD01”). Inside the folder, you will find some Matlab format files and text files. The text file indicated the name of the raw data recorded in different protocols. The Matlab files included raw data and results generated by the provided Matlab code.
For example, under folder “PD01”, you will find “RestSitting.txt”. In this text file, you will find “RL2_Rest_1_Flt”, indicating the raw data for rest while sitting. When you load “RL2_Rest_1_Flt.mat”, you will see four fields including “ChannelName” (name of each recorded channel), “ChannelType” (type of each channel), “data” (a matrix of the raw time-serials for all recorded channels), and “Marker” (indicating event information, only valid during stepping/walking).
Markers
Note 1: the accelerometer measurements were used to identify each walk cycle during free walking, while the force measurements were used to identify each step cycle during stepping (while sitting or standing).
Note 2: Each walking/stepping block (with multiple cycles) can be retrieved from “Marker.Marks”. Specifically, Marker.Marks(:,1) = 0 indicates the start point of a block while Marker.Marks(:,1) = 1 indicates the end point of a block. The corresponding time could be retrieved from “Marker.Times”.
Note 3: For stepping movement (while sitting or standing), each stepping cycle in a block can be retrieved by detecting the zero-crossing points of the recorded force measurements. In He et al., 2021, the zero-crossing point indicated phase -pi/pi, but you could have different determination on this.
Note 3: For free walking movement, each walk cycle in a block can be retrieved from “MarkerWalk.Marks”. Specifically, MarkerWalk.Marks(:,1) = 16 indicates a consistent walk phase, the corresponding time stamp could be retrieved from “MarkerWalk.Times”.
Note 4: Once a certain phase was determined for each cycle, the phases for all other time points could be determined through linear interpolation.
Note 5: Please see the provided code for gait-phase detection.
Code
The full Matlab source code including pre-processing, power spectral density calculation, coherence calculation, gait phase determination, phase-locked power modulogram, modulation index, permutation-based statistical analysis, and the relevant toolbox/functions are provided. This also includes the code to generate the figures (1-6) in He et al., 2021. Fig. 7-8 are not included due to patient identification in the scans.
We welcome researchers wishing to reuse our data to contact the creators of datasets. If you are unfamiliar with analysing the type of data we are sharing, have questions about the acquisition methodology, need additional help understanding a file format, or are interested in collaborating with us, please get in touch via email. Our current members have email addresses on our main site. The corresponding author of an associated publication, or the first or last creator of the dataset are likely to be able to assist, but in case of uncertainty on who to contact, email Ben Micklem, Research Support Manager at the MRC BNDU.

Creative Commons Attribution-ShareAlike 4.0 International (CC BY-SA 4.0)
This is a human-readable summary of (and not a substitute for) the licence.
You are free to:
Share — copy and redistribute the material in any medium or format
Adapt — remix, transform, and build upon the material for any purpose, even commercially.
This licence is acceptable for Free Cultural Works. The licensor cannot revoke these freedoms as long as you follow the license terms. Under the following terms:
Attribution — You must give appropriate credit, provide a link to the license, and indicate if changes were made. You may do so in any reasonable manner, but not in any way that suggests the licensor endorses you or your use.
ShareAlike — If you remix, transform, or build upon the material, you must distribute your contributions under the same licence as the original.
No additional restrictions — You may not apply legal terms or technological measures that legally restrict others from doing anything the licence permits.